–Introduction–
Life stages of animals are dependent on periodical environmental factors. This can include temperature, precipitation, and amount of daylight. As climate change continues to occur, these specific environmental events that animal life stages are evolved around will continue to change. For example, places that have specific rainy seasons also have animals that depend on those heavier periods of rainfall, and if those periods stop dropping the amount of rain needed to trigger these life stages then selective pressures are going to act on those animals. The same goes for factors such as temperature. If the temperatures for areas such as a tundra begins to increase, then the plants and animals adapted to the colder temperatures are going to start having environmental fitness issues. A secondary effect of this phenomenon is called ecological mismatch. This occurs when the life cycle of one organism is disturbed because it depends on the life cycle of another organism that had its environmental cues shifted by climate change. For example, animals that molt their coats to a white color in the winter to match the snowy background depend on sunlight cues to change their coat colors, however as climate change keeps snow off the ground longer, these animals then become color mismatched against the still dark background. Field research has shown that these coat color mismatches have increased predator-induced mortality (Siren et al. 2019).
–Long-Term Temperature Trends–
The mean temperatures being shown in the graphs below were collected as monthly mean temperatures by the United Kingdom Meteorological Office from 1659-2016 in the cities of London, Bristol, and Preston.
The variable plotted on the x-axis is the year the data was collected, and on the y-axis is the mean temperature that was recorded for that year. This was done in order to clearly show the trend when comparing temperature to the year associated with it, because if they swapped positions then it would be difficult to see the linear progression associated with such trend.
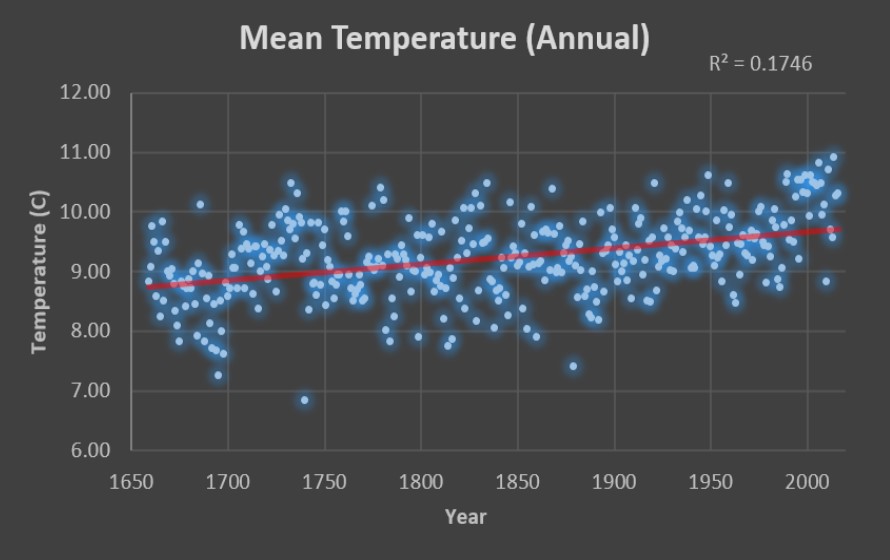

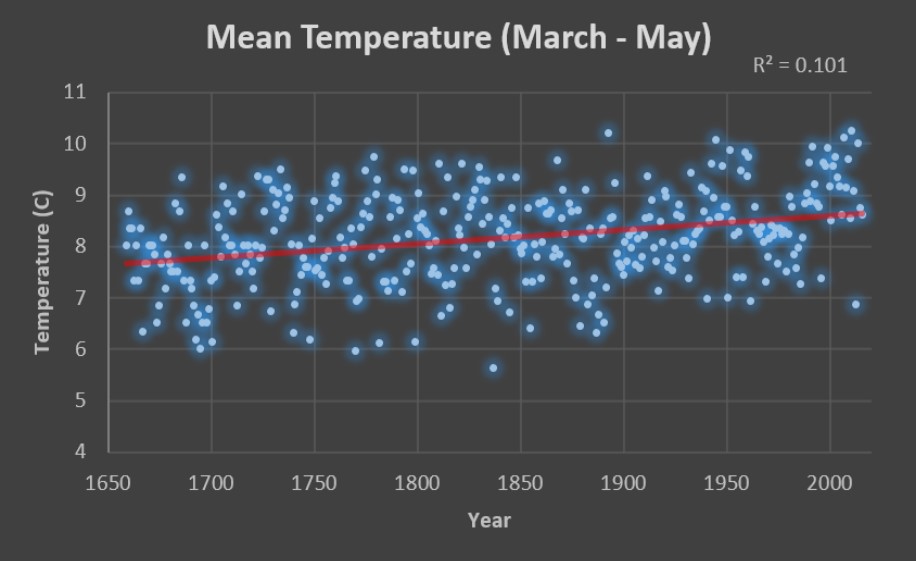
Based on the trend lines for the mean annual temperatures, mean Feb-Apr temperatures, and mean Mar-May temperatures, it appears that the mean temperatures for the last three hundred and seventy years has uniformly increased at a reasonably constant rate. This rate has been roughly one degree every three hundred years. The correlation coefficient (R2) represents how strong the relationship is between two variables. This relationship has a scale range of 0-1. The closer R2 is to 1, the stronger the relationship between the two variables. The graphs above all show their R2 in the top right corners. When comparing R2 between Feb-Apr mean temperatures and the Mar-May mean temperatures, we see that the Mar-May temperatures have the greater R2 value of 0.101. This implies that the data recorded forms a more related connection; hence a more correlated trend line is being shown.
–References–
-Siren, A., Nowak, J., Bryan, A., Ivan, J., Zimova, M., Sirén, A., … Morellato, P. (2019). Local climate determines vulnerability to camouflage mismatch in snowshoe hares. Global Ecology & Biogeography. https://doi.org/10.1111/geb.13049

