Methods
The procedure for sampling every year involved groups of four. Each group selected four total locations around campus, two locations that were green and two locations that were paved. Each group had a sampling kit containing a box of ziplock bags, five mason jars containing liquid food baits (water, sugar, oil, salt, and amino acid), index cards, flags, thermometer, plastic spoons, and four ant experiment signs. At each location, five cotton balls, each soaked in a unique liquid food, was placed on a labeled index card and left to sit for an hour. Group name, date, food bait, name of sampling location, and whether or not the location was green or paved was written on every index card.
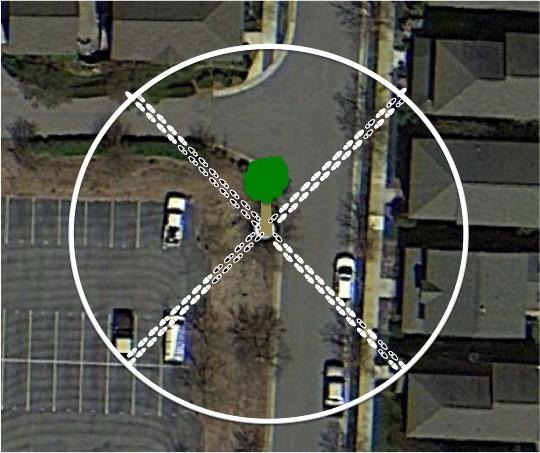
The thermometer was used to record the temperature (°C) of each sampling location, and the percent of impervious surface of the area was calculated using the Pace-to-Plant method. This method was executed by starting at the sampling location, and taking 25 steps at all four 45° angles (Fig.1). Out of all 100 steps taken, we divided the amount of steps that we took on pavement by the total of 100 steps taken to get the percent of impervious surface. After an hour, each index card, containing the food bait and ants, was put into an individual ziplock and brought back to the lab for counting.
Results
With the data acquired, we compared and analyzed the relationship between the independent variables (impervious surface percentage, temperature, food bait) and the dependent variable (number of ants) for years 2016-2018.
First, each food bait was compared to the amount of ants found on them. Below, figures 2-4 show this relationship. In 2016, the choice of food was overwhelmingly cookie and sugar, and for 2017 and 2018, cookie and oil were the preferred choice of food. The massive difference in ant abundance and food bait choice in 2016 is due to a drought. The lack of water would inevitability drop population numbers and emergence patterns in the ants.

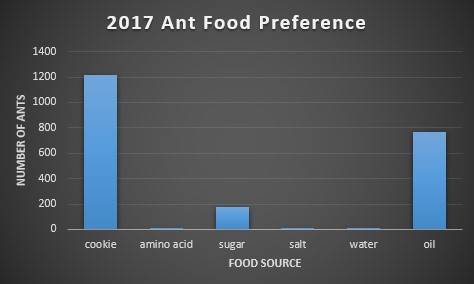
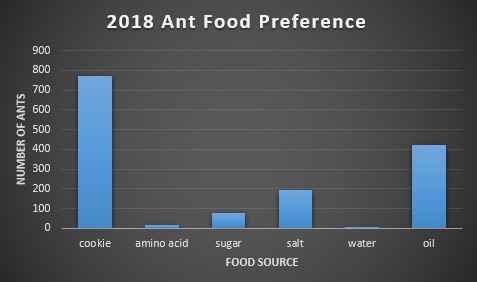
Second, we ran a one-way ANOVA on food preference for each year in order to find if there was a significant preference for certain baits over others. For 2016 the p-value was 0.058, for 2017 it was 0.13, and for 2018 it was 0.051. Due to all p-values being greater than 0.05, we cannot conclude that there’s a significant difference in food preference among baits. On an ecological level, this could imply that ants are very versatile in their consumption needs, making them more adaptable to environmental change.
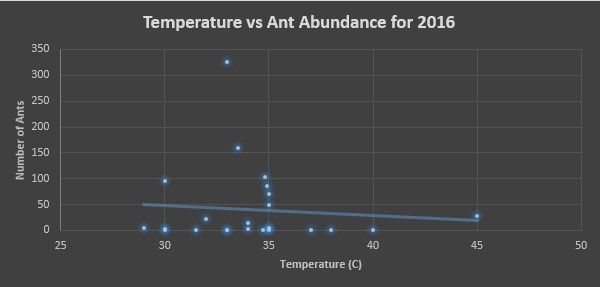
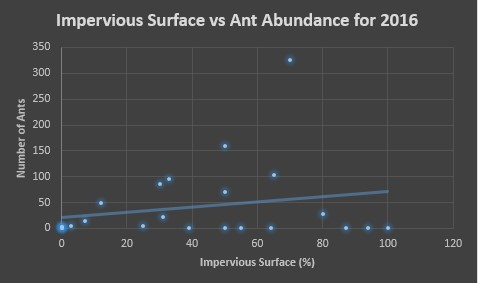
Finally, for each year we made two scatter plots, one assessing the affects of temperature on ant abundance and the other assessing the affects of impervious surface percentage on ant abundance. In figures 5 and 6, we see these assessments for 2016. Figure 5 shows a majority of ants being counted in temperatures ranging from 30-35°C, and figure 6 we see that areas ranging in 50-70% impervious surface area had the most ants counted.
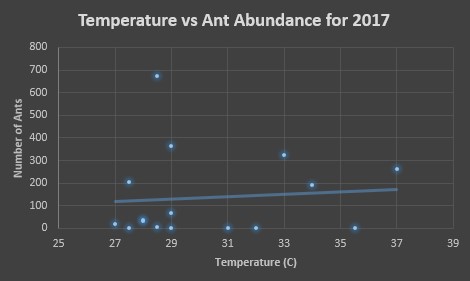
Below, in figures 7 and 8, we see the same comparisons for 2017. For the temperature, the trend indicates that the preference is similar to that of 2016, 30-35°C. However, the trend is weak. Figure 8 indicates an ant preference for impervious surface to be around 50-80% of the surrounding area.

The ant abundance was also at its peak between 30-35°C for the year 2018. In order to better understand the data, a point outside the range of this graph was excluded from view, however the data point is still influencing the trend line. It was for a location where 780 ants were counted in 32°C. The same data point was removed from figure 10, where 780 ants were counted at 77% impervious surface. Here the area with 50-80% impervious surface was where a majority of ants were counted.


We see over the three years that the impervious surface percentage that produces larger ant numbers stays relatively similar, around 50-70%. This is ecologically significant because we normally think of environmental fragmentation as being a negative on animals. We might assume from this that lack of competition from other ants, due to the impervious barriers, could allow colonies to maintain a balance between population abundance and resource competition. Temperature was another factor that seemed to be important in the amount of ant activity, as all three years showed a prefer-ability for 30-35°C.
Bugs in Manhattan
A similarity between this study conducted in Manhattan and the one we performed is the impact of ants on the urban environment. In their study covering 150 blocks of street medians, ants devoured thousands of pounds of trash over the course of a year (Bakalar, 2014), which fits with the quick response time of all the ants in our study. Within just an hour, there were hundreds of ants lining up for the food we laid out.
The prosperity of these insect populations could mean that the urban space is an ideal environment for insects. With green spaces fragmented, insects compete less with one another while receiving an increase in dropped food scraps. The fragmentation can also act as an environmental barrier, like mountains do to small mammals, posing the potential to cause speciation among a parent insect species. Other organisms that may benefit from the urban environment are birds. One study looked at which birds would survive better being spontaneously place on an oceanic island, urban birds or rural birds (Møller, et al. 2015). It found that the urban birds were much more successful at establishing themselves than the rural birds were. This implies that birds born and raised in urban areas are being effected cognitively by the environment.
Humans can help improve the function of cities as ecosystems by simply being more aware and mindful of their actions. Choosing to throw your food on the grass rather than feeling morally obligated to pick up after yourself is a great start. Cities can also have regulations in place that require construction companies and developers to allocate at least 30% of the property to green space. This would ensure that urban development couldn’t over-fragment the environment to the point of mass insect extinctions.
References
–Bakalar, N. (2014, Dec 2). Bugs in Manhattan Compete With Rats for Food Refuse. Retrieved from https://www.nytimes.com/2014/12/02/science/bugs-in-manhattan-compete-with-rats-for-food-refuse.html
–Møller, A., Díaz, M., Flensted-Jensen, E., Grim, T., Ibáñez-Álamo, J., Jokimäki, J., … Tryjanowski, P. (2015). Urbanized birds have superior establishment success in novel environments. Oecologia, 178(3), 943–950. https://doi.org/10.1007/s00442-015-3268-8

