Results
The relative fitness of the dark-colored Peppered Moths in the experiment, whether that be the homozygous dominant (MM) or heterozygous (Mm) genotypes, experienced an increase or no change with the increase in pollution over time, however the relative fitness of the light-colored homozygous recessive (mm) genotype experienced a decrease in relative fitness over time. Going from low pollution to high pollution (low-moderate-high), the relative fitness of the homozygous dominant genotype was 1-1-1, the heterozygous genotype was 0.33-0.4-1, and the homozygous recessive genotype was 1-0.5-0. This shows a clear correlation between the change in environment and its selection against the light-colored Peppered Moths. Therefore, the darker-colored Peppered Moths have a greater ability to survive in an environment with increased pollution due to the increased predation of light-colored Peppered Moths. The bar graph below (Fig.1) shows this change in relative fitness by tracking the genotype frequency over time as the pollution increased.
The allele frequency of the Peppered Moths were also calculated and graphed between generations as the pollution levels transitioned from low to high. In the graph below (Fig.2), the allele frequency of the dominant (p) and recessive (q) alleles are relatively balanced in their expression within the low pollution environment over all four generations.

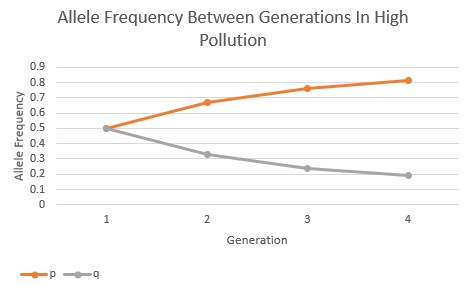
However, as the pollution increased in the environment the allele frequencies began to change in response. In the moderate pollution environment (Fig.3), the recessive allele is passed on to the subsequent generations in lesser and lesser frequency, and the dominant allele increases in frequency over the subsequent generations. The pollution is showing to have a directional selection in favor of the darker-colored, phenotypic expression of the Peppered Moths.
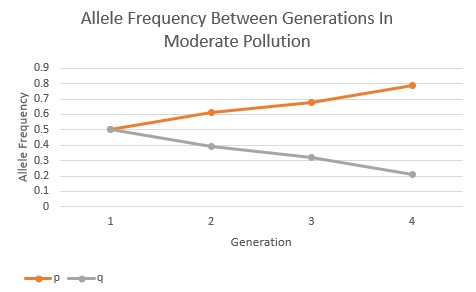
In the high pollution environment, the selection of the dominant allele over the recessive allele occurs at an even faster rate when compared to the moderate pollution environment, as seen below (Fig.4). Between all three of these allele frequency graphs, it’s evident that the rate and intensity of directional selection increases as the pollution increases, showing a clear correlation between the two variables.