A blog post by Derik Verkest and Bo Nash
Background
Evolution is the mechanism through which the organisms that are around today came to be. Evolution occurs when an organisms genes and alleles are changed over a period of time. In short, genes are an organism’s characteristics, while alleles are their traits. This evolution and change in alleles occurs in many ways, but today we will be discussing evolution through a process called natural selection. Natural selection is when an organism is chosen naturally based off of if they can survive in the ecosystem that inhabit. In order for natural selection to occur, certain conditions must be met: 1) there are more offspring being produced than the environment can support, 2) there is variation among individuals, 3) this variation is inherited, 4) some individuals will survive and reproduce at higher rates than others. Knowing when populations are undergoing evolution is an important aspect that scientists study. In order to determine whether a population undergoes evolution, scientists use a mathematical model called the Hardy-Weinberg Equilibrium. This mathematical equation is represented as: p^2+2pq+q^2=1. This might seem complicated, but it actually the opposite. All of the “p” values represent the dominant allele while all of the “q” values represent the recessive allele. A dominant allele is usually represented by a capital letter and the trait that this allele represents is the one that is physically shown by the organism. A recessive allele is the opposite. It is represented by a lower case letter and it’s trait is only shown when there are two recessive alleles, or homozygous. Along with evolution and the Hardy-Weinberg equilibrium, this experiment will show the relative fitness of our populations. This is not the fitness that you think of. It’s not bench pressing or squatting or muscle size. Relative fitness is an organism’s reproductive success, or how successful an organism is at passing down its genetics to the next generations.

Credit: https://cdn.helix.com/wp-content/uploads/2018/09/Natural_Selection_b.png
Experiment
A classic example of evolution and natural selection are the moths during the industrial revolution. Scientists found that moths with darker colors were more likely to survive in highly polluted areas while moths with a lighter color would not survive in polluted areas, but would survive more often in nonpolluted areas. The dark color is called melanistic while the light color was called mottled. For your ease of understanding these are the following genotypes and corresponding phenotypes. The melanistic moths are represented by MM and Mm. The mottled moths will be represented by mm. Three different “environments” were used to determine allele frequency and fitness. A dark environment with few light spots, a mixed, and a light environment with few dark spots. Over the course of 4 generations, we spread out representatives of the different colored moths and determined their allele frequencies. For example, we put dark and light moths in the dark environment. When we mixed the population the dark moths that were on the dark surfaces would stay but the light moths on the dark surface would be taken out. This is how each experiment in each environment went and this determined the next generation’s population composition. For the remainder of this blog posts you will see graphical representations of what we found and why it is important.
Results
The relative fitness of the dark-colored Peppered Moths in the experiment, whether that be the homozygous dominant (MM) or heterozygous (Mm) genotypes, experienced an increase or no change with the increase in pollution over time, however the relative fitness of the light-colored homozygous recessive (mm) genotype experienced a decrease in relative fitness over time. Going from low pollution to high pollution (low-moderate-high), the relative fitness of the homozygous dominant genotype was 1-1-1, the heterozygous genotype was 0.33-0.4-1, and the homozygous recessive genotype was 1-0.5-0. This shows a clear correlation between the change in environment and its selection against the light-colored Peppered Moths. Therefore, the darker-colored Peppered Moths have a greater ability to survive in an environment with increased pollution due to the increased predation of light-colored Peppered Moths. The bar graph below (Fig.1) shows this change in relative fitness by tracking the genotype frequency over time as the pollution increased.
The allele frequency of the Peppered Moths were also calculated and graphed between generations as the pollution levels transitioned from low to high. In the graph below (Fig.2), the allele frequency of the dominant (p) and recessive (q) alleles are relatively balanced in their expression within the low pollution environment over all four generations.

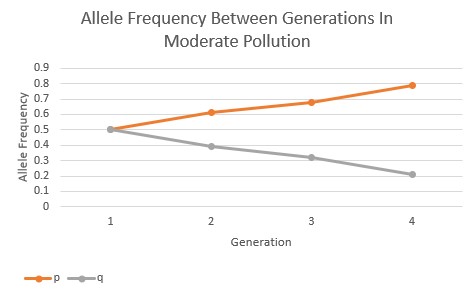
However, as the pollution increased in the environment the allele frequencies began to change in response. In the moderate pollution environment (Fig.3), the recessive allele is passed on to the subsequent generations in lesser and lesser frequency, and the dominant allele increases in frequency over the subsequent generations. The pollution is showing to have a directional selection in favor of the darker-colored, phenotypic expression of the Peppered Moths.
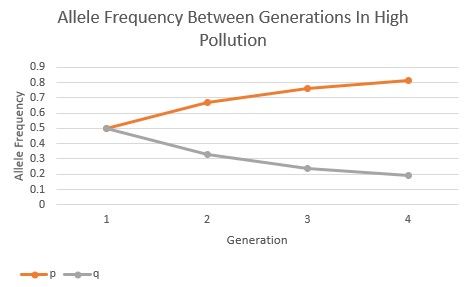
In the high pollution environment, the selection of the dominant allele over the recessive allele occurs at an even faster rate when compared to the moderate pollution environment, as seen below (Fig.4). Between all three of these allele frequency graphs, it’s evident that the rate and intensity of directional selection increases as the pollution increases, showing a clear correlation between the two variables.
Bar Graphs
Below are three bar graphs that show the allele and genotypic frequencies of the types of moths over a course of four generations. These graphs also show this data across all three environmental representations of low pollution, moderate pollution, and high pollution.

Credit: Bo Nash

Credit: Bo Nash

Credit: Bo Nash
Instead of analyzing all of these individually we will look at the results of the experiment as a whole. The idea of melanistic moths surviving in more polluted environments hold true. This is shown in both the high and moderate pollution graphs, which show that the homozygous dominant (MM) and heterozygous (Mm) genotypes for the melanistic moths were at the highest frequencies. This also shows that the lighter molted moths (mm) did not survive in these environments throughout the generations, but had their highest frequencies in the low pollution environments, which was expected.
External Article
The article that was assigned along with this experiment was “Man’s new best friend? A forgotten Russian experiment in fox domestication”. This article showed Russian Scientists in the early and mid-19th century attempted to domesticate wild foxes based off of how tame they were when they interacted with humans. Belyaev selected for this tameness by having the foxes interact with humans while being fed. If the fox would hiss and go away they were not allowed to breed, but if they were OK with human contact and even welcomed it they were selectively bred. It was expected that there would be some change in domesticated fox behavior as more generations were formed, but not that much. These foxes formed droopy ears, smaller tails, welcomed and sought out human contact, and even lost some of their “musky fox” scent. This shows that artificial selection for a trait does work.
Credit
Bo Nash: Introduction, Experiment, Bar Graphs, Discussion
Derik Verkest: Results, Line Graphs, External Article
Peer Reviewed Article
Although not about moths, this peer reviewed article on evolution and adaptation of seeds of Japanese Orchids can help clarify ideas of evolution and also provides another example of how the environment can influence an organism over time.
- Shimizu, N., Sawa, Y., & Sawa, S. (2012). Adaptation and Evolution of Seed Shape on Bleeding Area in Japanese Orchids. International Journal of Biology, 4(2). https://doi.org/10.5539/ijb.v4n2p47
Works Cited:
- Goldman, Jason G. “Man’s New Best Friend? A Forgotten Russian Experiment in Fox Domestication.” Scientific American Blog Network, Scientific American, 6 Sept. 2010, blogs.scientificamerican.com/guest-blog/mans-new-best-friend-a-forgotten-russian-experiment-in-fox-domestication/
- Shimizu, N., Sawa, Y., & Sawa, S. (2012). Adaptation and Evolution of Seed Shape on Bleeding Area in Japanese Orchids. International Journal of Biology, 4(2). https://doi.org/10.5539/ijb.v4n2p47
