A blog post by Derik Verkest and Bo Nash
Introduction for Part 1
The regulation of internal body temperature is important to the survival of organisms. Every animal does this differently, but the common goal at the end of it all is to have the internal temperature required to catalyze reactions and biochemical processes inside the body. There are two main types of internal temperature regulation strategies performed by animals, ectothermy and endothermy. Ectothermic animals keep their internal temperature stable using the external environment, and Endothermic animals use the heat produced from their metabolism to keep their internal temperatures stable. Along with these two main strategies, animals also use a mix of other physiological, anatomical, and behavioral adaptations to help make these processes as efficient as possible. These include surface area to volume ratios, the use of fat or fur to assist in insulation, hibernation, and basking practices. For example, in order to avoid lethal internal body temperatures endotherms need to be able to dissipate that heat quickly (Nilsson et al. 2016). One strategy that can be used for this problem is by having a high surface area to volume ratio. In our case as humans, we use this method along with our superior ability to cool off through perspiration. The goal of the experiment in part 1 will be to observe the effects of external temperature on the heating and cooling of an organisms internals.
Experimental Method for Part 1
In our first experiment, we took kitchen-grade aluminum foil and made a roughly ten-cubic-centimeter cube shape out of it to represent the body of an animal, most likely an ectotherm in this case. We then took the initial temperature of the inside of the cube, using a basic glass thermometer, prior to its heating. Once we recorded this initial temperature, we placed the aluminum cube about fifteen centimeters under a heat lamp to replicate sun exposure. While under the heat lamp, we took temperature readings of the inside of the cube every thirty seconds. We continued to record until a temperature plateau was reached, turned off the heat lamp, then recorded the temperature until it roughly reached the initial temperature prior to placing the cube under the heat lamp.
Results for Part 1
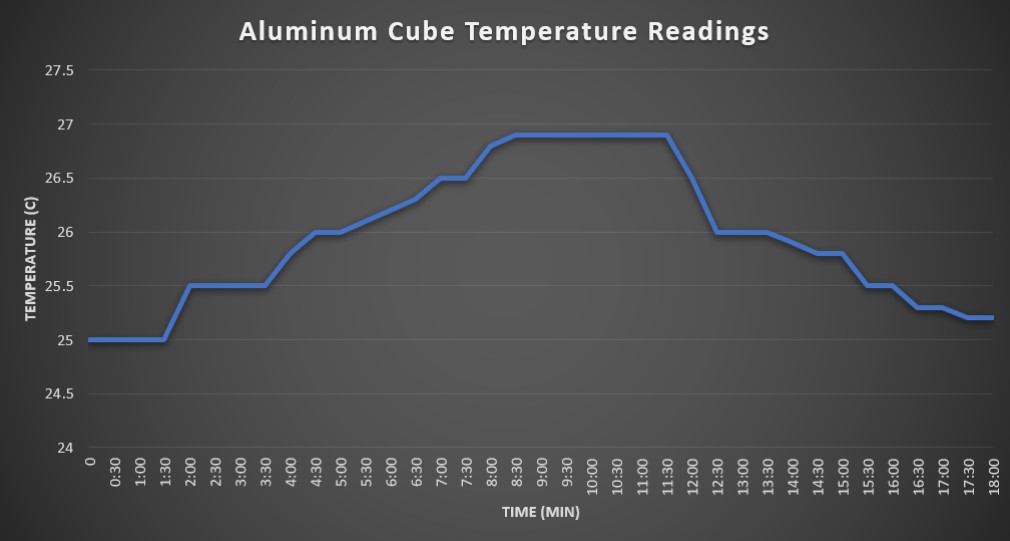
The initial internal temperature reading of the aluminum cube was 25°C. It took approximately 18 minutes total for the cubes interior to reach maximum temperature and return to baseline. For the first nine minutes, the interior heated at rate of roughly 0.5°C per 2-3 minutes. Peak temperature of 26.9°C was reached and sustained from 9 minutes to 11:30 minutes. At the 11 minutes mark, we turned the light off and recorded the cooling period. The rate of cooling was roughly 1°C per 2-3 minutes until it reached baseline around the 18 minute mark.
Conclusion of Part 1
We observed that the heat emitted by the heat lamp was able to slowly heat the interior of the aluminum foil cube to a constant temperature of 26.9°C. This aluminum cube in the experiment is most analogous with ectotherms, as it lacked a large size, insulation, or an internal source of heat. Variables that may have affected the accuracy of the data collected include sunlight exposure from nearby windows, the aluminum material having a specific heat capacity that influenced how the heat was absorbed, other openings in the cube allowing heat exchange with the external environment, and the position of the cube to the heat lamp used in the experiment.
Individual Experiment
After analyzing the graphs and the trends that our ‘animal’ did in Part I we decided to conduct an experiment of our own. This experiment involved two aluminum animals with cotton balls in their interior in order to represent endotherms. The variables that we were comparing were the colors of the substrates. This being if the ground beneath the animal’s feet is dark or light. This was of interest to us based off of what we knew about heat island effect and the difference between heat on a dark surface, such as a tar road, or a light surface, such as sand. The information that we were looking for was to see which surface caused the endotherms to heat up the fastest. The thermometers and the interior of the endotherms was a constant 25 Celsius without any outside heating added. We then put each animal on either a black or white surface and placed them under a heat lamp. In order to provide consistent information we measured how long it would take for the animals to get warmer by 2 degrees Celsius to 27 degrees.
Hypothesis: The endotherm on the dark substrate will increase in temperature faster than one on a light substrate.
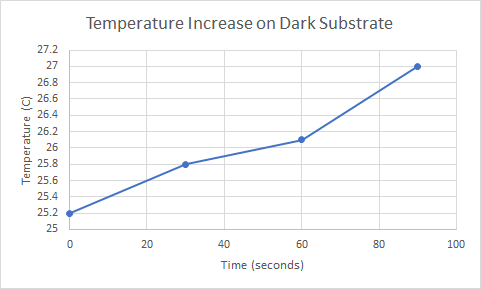
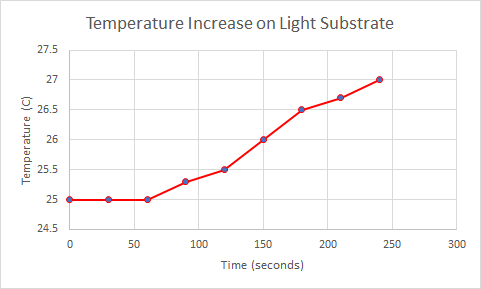
The data below is from the first round of experiments that were conducted to see the relationship between color of substrate and time it took for the temperature to increase. It shows that it takes 90 seconds for the endotherm on the dark substrate to increase temperature to 27C while it takes 240 seconds for the endotherm on the light substrate to increase to 27C.
Bo Nash
Bo Nash
The data below this column will show the increase of temperature for the second round of this experiment. The results almost directly correlate to the data from the first round of the experiment. Below you will see data that shows the endotherm on the dark substrate reaching 27C in 60 seconds while it takes the endotherm on the light substrate 150 seconds to reach the same temperature.

Bo Nash

Bo Nash
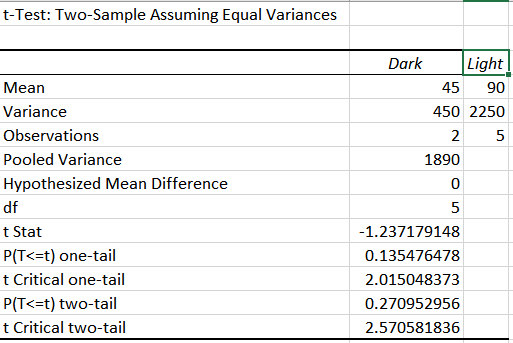
Now that there is usable data from these two rounds of experiments, we can now run a statistical analysis to determine if the two sections were that different. Since we are only comparing two variables (dark vs. light substrate), the statistical analysis that will be used is called the T-test. If the ‘p’ from this test is less than 0.05, the the groups are determine to be significantly different. If ‘p’ is greater than 0.05 then we can’t tell the groups apart.
The data below represents the T-test for trial 1:

Bo Nash
The data below represents the T-test for trial 2:
Bo Nash
After analyzing this information, it can be seen that it takes a significantly longer time for the temperature to increase on a light substrate rather than a dark one. Eyeballing the numbers will tell you this but if you rely on the T-test it will tell you that the two groups are difficult to tell apart, as both of their values exceed 0.05.
Part II: Dinosaur Thermal Regulation
After reading this study, we found that there were similarities found that matched some of our own observations. From the heating and cooling curve information presented at the beginning of this blog post, it can be seen that ectotherms both increase and decrease in response to environmental temperature significantly faster than the endotherms in our individual experiment. The article put it best that “endothermy as mass-independent energy expenditure”. This meaning that the metabolism remains consistent regardless of size, whereas ectotherms are highly dependent on size and environmental conditions. This is the reason that dinosaurs began to decrease in size and eventually evolve into birds, because being and endotherm is highly advantageous to hunters and animals that want to migrate into different environments.
Communicating these results across a gradient of ages is an important part of being a scientist. These results might seem complicated even to someone who has been educated. But science communication doesn’t discriminate it’s readers based on age or education level. In order to show this we will communicate the information found in the dinosaur article to a middle school student and a retiree. To the middle school student we would have to make sure that endotherm and ectotherm were described as “the animal is OK with all temperatures” and “the animal needs warm temperatures to live comfortably” respectively. Since middle schoolers have an active imagination we will then tell them about how dinosaurs became what we see as today as birds and how being and endotherm is beneficial. And to the retiree we will be able to use more complicated terms, seeing as they have been exposed to scientific information either directly or indirectly throughout their life.
Credits:
Bo Nash: Individual Experiment & Part II
Derik Verkest: Introduction, Part I, Peer Review Citation
References
-Jeewandara, Thamarasee. “Shrinking Dinosaurs and the Evolution of Endothermy in Birds.” Phys.org, Phys.org, 15 Jan. 2020, phys.org/news/2020-01-dinosaurs-evolution-endothermy-birds.html.
-Nilsson, J., Molokwu, M. N., & Olsson, O. (2016). Body temperature regulation in hot environments. PLoS One, 11(8) doi:http://dx.doi.org.proxy.lib.utc.edu/10.1371/journal.pone.0161481
